Serious Questions Linger Even as Bulls Close June Strong
Big caps advanced modestly with a tentative hitch in their step this week, while small caps knocked the ball out of the park.
Topping the new high list for big caps during the final week of June was a real group of relative nobodies — BHP Corp (BHP), the Aussie miner; ICICI (IBN), an Indian bank; Telekom Indonesia (TLK), IHS Markit (INFO), Jacobs Engineering (JEC), aerospace parts maker Heico (HEI) and aerospace metals maker Hexcel (HXL). A basket of cats and dogs, a very eclectic and uninspiring vanguard.
While the week’s gains were pegged to rising hopes of a trade deal with China, the outlook for compromise remains iffy. Chinese President Xi Jinping plans to present President Trump with a set of terms the U.S. should meet before Beijing is ready to settle its market-rattling trade confrontation.
The WSJ reported that Beijing insists the White House remove its ban on the sale of U.S. technology to Chinese telecom giant Huawei Technologies as a precondition. Beijing also wants the U.S. to lift all punitive tariffs and drop efforts to get China to buy even more U.S. exports than Beijing said it would when the two leaders last met in December.
These look like a big ask. There’s a lot riding on the talks.
If the U.S. and Chinese leaders are unable to compromise and stage a happy photo op this weekend, markets are expected to throw a tantrum.
***
Best Offense is a Good Defense?
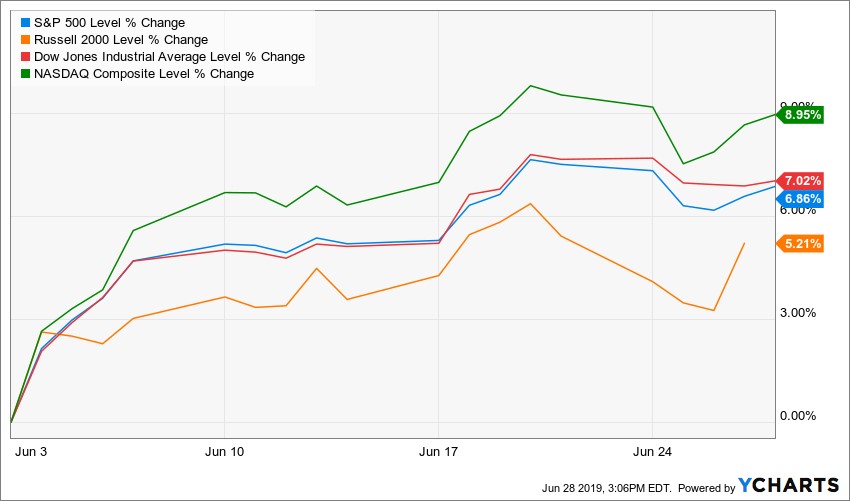
Capital Economics analysts note a critical feature of the 6% rise in the S&P 500 this month. That is, cyclical stocks — which have historically driven its rally — have not outperformed this time.
One theory suggests that this improves the resilience of the U.S. stock market to the weaker economic backdrop. But CapEcon fades that view.
The rise in the S&P 500 since the global financial crisis has been fueled by the outperformance of cyclical stocks.
They have benefited most from the expansion in the U.S. economy over this period. That is why the recent rally in the S&P 500 to a record high last week appears, at face value, to be slightly unusual.
Since the start of May, cyclical stocks have actually underperformed their defensive peers.
One school of thought suggests that this is a reason not to worry about the high level of the stock market, despite the recent plunge in U.S. Treasury yields.
After all, the defensive sectors which have benefited the most of late — namely healthcare and utilities — are not those that typically do well during periods of irrational exuberance.
CapEcon analysts are not convinced by this argument, though. The ratio of U.S. cyclical to defensive stocks has no clear predictive power over the performance of U.S. stock market in the near future.
Admittedly, the ratio peaked around six months before the S&P 500 crashed in 2000. But cyclical stocks underperformed their defensive peers for over three years prior to the global financial crisis.
The upshot is that investors’ rotation into stocks classified as defensive is unlikely to prevent the S&P 500 from falling sharply this year if the U.S. economy slows down dramatically in the second half of this year. CapEcon researchers think that the S&P 500 will drop by roughly 15% by the end of 2019 as U.S. companies’ earnings falter in the wake of a global growth slowdown caused in part by multiple trade wars.
***
Now let’s look at what’s happening at the Federal Reserve, as two key officials were on the rubber chicken circuit, talking about the hottest topic for investors now. We’ll turn to the great analysts at DataTrek Research for their take, which follows.
“An ounce of prevention is worth a pound of cure.” That’s about as close as Fed Chair Jay Powell came in his comments at a Council of Foreign Relations discussion to addressing what has become the burning issue of the day: Will the FOMC cut rates by 25 or 50 basis points at the July meeting?
St. Louis Fed President James Bullard had a more pointed take: “Just sitting here today, I think 50 basis points would be overdone.” Given that he voted for a 25-basis-point cut just last week, this should hardly have been a surprise. But U.S. equity markets dropped nonetheless.
Why the adverse reaction to his comment? Because Fed Funds Futures markets have been increasingly banking on a 50-basis-point cut next month. The data here: At yesterday’s close the odds of a 50 bp cut in July were up to 43%. Just a week before, they were only 18%. A month ago, they were less than 1%. By mid-afternoon, the odds of a 50 bp cut in July were down to 35%.
But here’s the funny thing about the latest Fed Funds Futures action: The odds that the FOMC will lower rates by 50 bp by the September meeting (the next one after July) actually increased from 54% to 58%.
Here’s why:
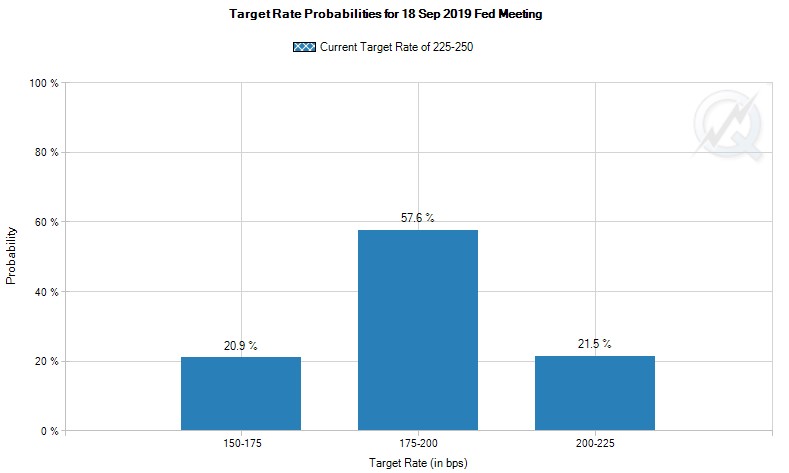
The inability of the U.S. economy to see measured goods and services inflation of 2% or more clearly worries the FOMC. Slower global growth and the uncertainties over global trade also play a role in their thinking.
On top of that, futures markets now have another cut by December as their most-likely case. The odds for rates 75 basis points lower than today are 40%. That is greater than the chance the Fed is done with 50 bps of rate reduction in 2019 (25%).
This raises an important question for the DataTrek analysts:
Have futures and bond markets overestimated the Fed’s likely trajectory of rate cuts in 2019?
The easy answer would be “Yes.” Expecting 75 basis points of cuts before seeing any real softening in labor market conditions looks aggressive. Yes, inflation is running below expectations, but that’s hardly new.
DataTrek’s view, however, is that markets have it more right than wrong.
- The dollar remains strong, dampening exports.
- Oil prices are 20% below last year’s levels. Measured inflation isn’t going anywhere.
- Business uncertainty over tariffs will only grow, and consensus estimates for Q2 and Q3 corporate earnings reflect zero growth.
All this sets up for risk to the labor market as companies adjust cost structures (i.e., lay people off).
So how does the Fed think about the merits of a 50-bp cut vs. 25 bp?
This is a case where “the dose makes the poison.” A larger cut in the absence of a clear reason for it may actually create more problems than it fixes. Investors will rightly wonder what the Fed knows or fears may be coming down the road.
Bottom line: Absent a shock, the Fed will move slowly to lower interest rates rather than taking outsized measures and that is better for stocks over the next six months anyway. Equities will see some churn in Q3 that’s largely predicated on a mismatch of Fed action vs. market expectations. As for the bigger picture, however, the die is cast. Interest rates are heading lower, and that should support higher U.S. equity valuations.
***
Major Negative Signal from Weak Smalls, Transports and Banks
Small caps, transportation stocks and banks have been lagging the market badly. Sentiment guru Jason Goepfert reports that, relative to the S&P 500, all three indexes just hit new lows, within days of the S&P 500 being at a record high.
Turns out that this is highly atypical behavior, and has not been a good sign when seen in the past.
Goepfert riffed his database to discover every time the S&P 500 hit a high and then, within 10 days, at least two of the three other indexes (IWM, XLF and IYT) hit a new low relative to the S&P 500. There were only two times when all three did so.
“Might wanna take a stiff drink before looking at the forward returns” from these incidences, Goepfert says.
When two of the three were at lows, it was a bad enough sign. The S&P 500’s forward returns were well below random, marked by a decline averaging 12% in the next two months. It was even worse when all three were at relative lows.
Over the next couple of weeks, there was a consistent pattern of weakness, including after every signal since 1990. Even up to the next three months, risk exceeded reward. It wasn’t necessarily a “bull killer” kind of thing, though, since only two of them showed negative one-year returns.
The most troubling thing, the analyst reports, is that — after the only two other times when all three indexes traded at a relative low at the same time — the S&P 500 lost at least 15% at some point during the next three months.
Looking at the other indexes after at least two of the three hit a low relative to the S&P 500, their absolute returns were mostly poor. Especially banks.
Versus the S&P 500, their returns were even worse. Not one of the three outperformed the S&P consistently over any time frame, and typically they grossly underperform.
Bottom line: This is no time to bottom-fish for value among losers The overall signal is worrisome for stocks, and even more so for the three areas that have been lagging so badly.
Best wishes,
Jon D. Markman